Gold News

Last Time Gold Did This? 2011
Analysis of 3 key signals in Q1 2018's gold price action...
 
THANKS to Good Friday, this week ends early for gold investors and traders, writes Adrian Ash at BullionVault.
 
Like pretty much all of the Western world's bond and stock markets, the London gold market – center of the global wholesale trade – will stay shut for the long Easter weekend.
 
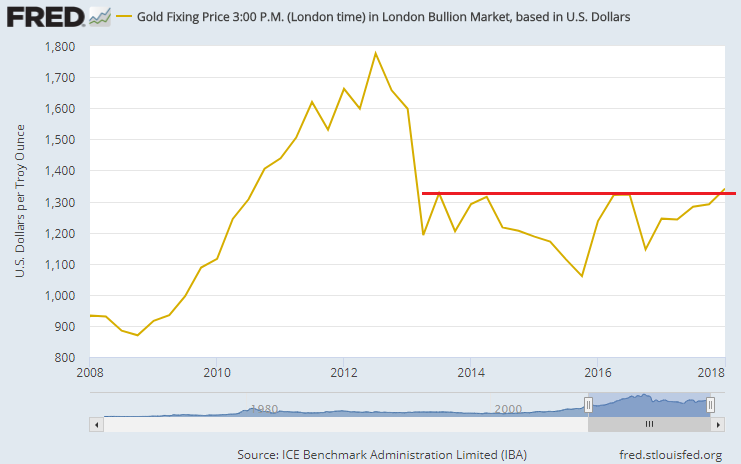
So keep an eye on Thursday afternoon's gold price benchmark in London. Because it will mark the closing price for the first calendar quarter of 2018.
 
And any 3pm price above $1326.50 per ounce will mark the highest quarterly finish in Dollar terms in 5 years for gold. [ Ed. note: It came in at $1323.85, just below the price of Q3 2013. Quarter-on-quarter, that gave gold in Dollars a 2.1% gain from end-2017.]
 
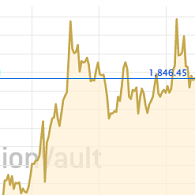
Chart of end-quarter LBMA Gold Price, US Dollars per ounce. Source: St.Louis Fed
 
Price is just a number for anyone yet to invest. But away from the daily noise of tick-by-tick financial news, longer-term time frames can help reveal the longer-term picture. 
 
Pulling out, we see how:
  • Ten years ago this March, the near-collapse and bail-out of Bear Stearns saw gold break above $1000 for the first time ever. The crash phase of the financial crisis was on.
  • Five years later the gold price sank at its fastest quarterly pace in 3 decades, plunging as investment funds sold on chatter about 'QE tapering'. Spurred by the end of ever-growing monetary stimulus from the Federal Reserve, that Q2 2013 gold crash agreed with the Fed that the global financial crisis was over. 
  • But now we're 5 years beyond that. And gold is trading at the top of the last half-decade's post-post-GFC price range.
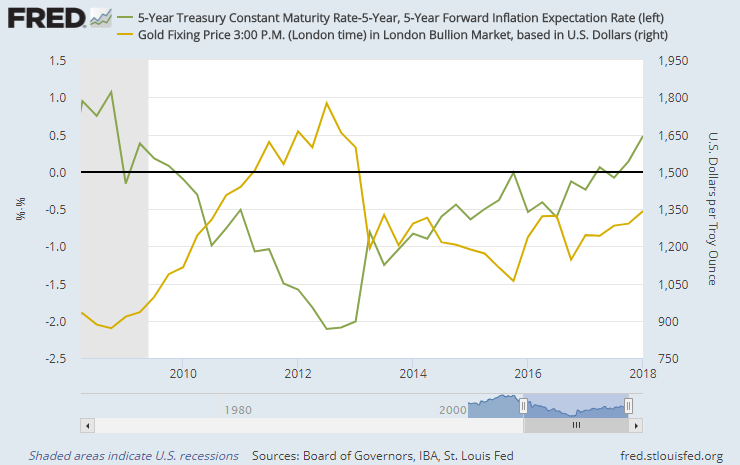
Second – and unless there's a collapse in bond yields between now and Thursday's close – our analysis says the final price of Q1 2018 will prove notable for gold's relationship with interest rates.
 
Gold pays no income of course. It doesn't do anything in fact. It doesn't even rust.
 
So very often, gold moves opposite to the direction of interest rates. Because if returns on cash and bonds are rising, the opportunity cost of owning gold instead goes up – and vice versa.
 
Most especially, gold tends to show an inverse link with real interest rates, after you account for changes in the cost of living. Because if cash in the bank fails to beat inflation, and by a worsening margin, then a lump of incorruptible metal – used to store wealth in all cultures in all ages of human history – will likely gain in appeal. And vice versa.
 
This is one reason why, despite 6 rate hikes from the US Federal Reserve since end-2015, gold priced in Dollars has risen by more than $300 per ounce. Because real US Fed interest rates have in fact gone down as the Fed has raised, thanks to stronger US inflation eating ever-more of your savings and cash deposits. 
 
Within that pattern however, something has changed since the fall of 2017. Because in the last 2 calendar quarters, real interest rates in the open market have been rising. So too has the gold price.
 
Look at market expectations for inflation versus 5-year bond yields. This measure of real US interest rates has now risen for two consecutive quarters, its longest run since the last 3 calendar quarters of 2015.
 
Back then gold prices fell below the 2013 crash, finally setting 6-year lows just as the Fed made its first hike to overnight rates.
 
But this time, in Q4 2017 and Q1 2018, gold prices have risen together with real 5-year rates.
 
That hasn't happened for two quarters running since 2011.
 
End-quarter chart of US 5-over-5 inflation-adjusted bond yields vs. gold price. Source: BullionVault via St.Louis Fed
 
Unless real rates drop by one-third of a percentage point between now and end-Thursday, or unless gold drops $50 per ounce in two days – both possible, but unlikely – the standard explanation for how rates and gold work will look very stretched.
 
Rather than defying the laws of physics however, gold is in fact doing what it did almost half of the time prior to the financial crisis.
 
Over the 20 calendar quarters from 2003 to 2008, gold moved in the same direction as real rates 9 times, some 45% of the time. That number fell to 7 during the 20 calendar quarters of financial crisis from 2008 to 2013. Over the half-decade after the GFC ended, gold rose or fell alongside inflation-adjusted 5-year bond yields just 4 times.
 
At a statistical level, that has taken gold's inverse relationship with real rates from 'Meh' to near-enough a 'Sure thing'. Up until now. Prices rose in both Q4 2017 and Q1 2018. So too did inflation-adjusted 5-year bond yields.
 
That last happened when gold prices hit their current all-time peak, touching $1900 per ounce in the third quarter of 2011 as the United States' credit rating was downgraded, mass rioting hit England, and the Eurozone debt crisis sent global stock markets into another tailspin.
 
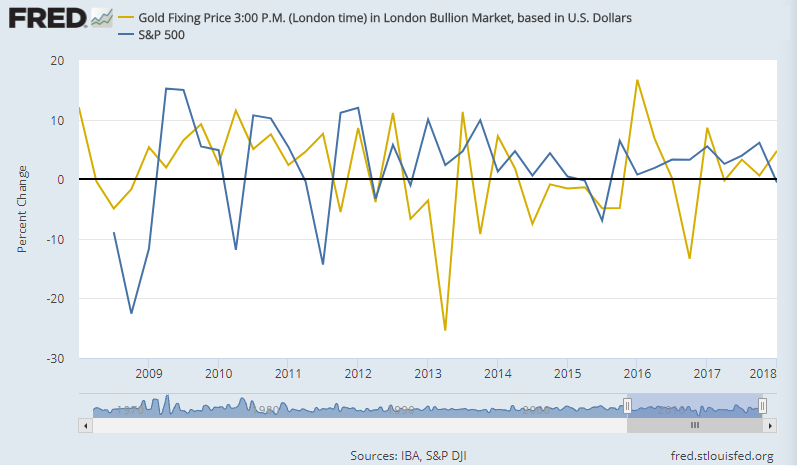
Talking of stocks, here's a third switch gold priced in Dollars is set to mark at end-March 2018:
 
The US stock market hasn't recorded a losing quarter at all since mid-2015. But it's now on track to break that run. And if the S&P 500 index doesn't add 60 points or more by Thursday's close, then it will have fallen while gold prices show a quarterly gain for the first time since – well – since the financial crisis peaked in 2011.
 
Chart of end-quarter percentage change in S&P500 vs. gold price. Source: St.Louis Fed
 
To recap:
  • We're now 5 years on from the Fed announcing the end of the global financial crisis with its 2013 taper talk. Gold is showing its highest quarterly close since then;
  • To get here, gold has shrugged off the rise in real interest rates. They acted as kryptonite during the first half of the post-GFC period. For now at least, that spell has been broken;
  • On a quarterly basis, gold also stands on the verge of doing exactly what investors want it to do: Go up when the stock market falls.
Straws in the wind maybe. But volatile rates and falling stocks could prove a chill wind for investors caught without the repeated  diversification offered by gold over the last half-century.

Adrian Ash

Adrian Ash, BullionVault Gold News

Adrian Ash is director of research at BullionVault, the world-leading physical gold, silver, platinum and palladium market for private investors online. Formerly head of editorial at London's top publisher of private-investment advice, he was City correspondent for The Daily Reckoning from 2003 to 2008, and he has now been researching and writing daily analysis of precious metals and the wider financial markets for over 20 years. A frequent guest on BBC radio and television, Adrian is regularly quoted by the Financial Times, MarketWatch and many other respected news outlets, and his views from inside the bullion market have been sought by the Economist magazine, CNBC, Bloomberg, Germany's Handelsblatt and FAZ, plus Italy's Il Sole 24 Ore.

See the full archive of Adrian Ash articles on GoldNews.

Please Note: All articles published here are to inform your thinking, not lead it. Only you can decide the best place for your money, and any decision you make will put your money at risk. Information or data included here may have already been overtaken by events – and must be verified elsewhere – should you choose to act on it. Please review our Terms & Conditions for accessing Gold News.

Follow Us

Facebook Youtube Twitter LinkedIn


Market Fundamentals