Forecast of US Debt
This chart projects only current spending growth...
U.S. GOVERNMENT debt is rising at its fastest pace since 2012, writes Joe Withrow, head of research at Bonner & Partners.
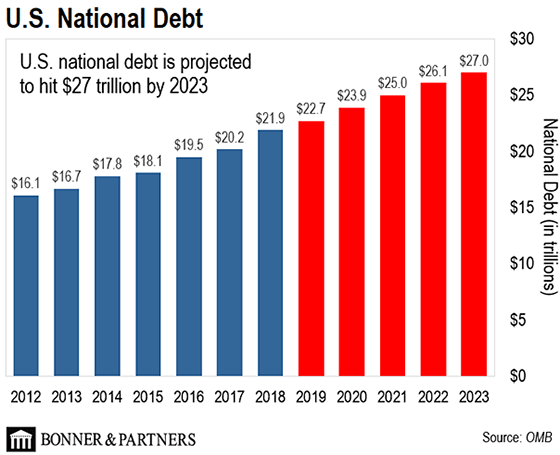
To illustrate this, today's chart maps the US national debt from 2012 through today...and projects it out five years using data from the US Office of Management and Budget (OMB).

As you can see, the US national debt jumped from $16.1 trillion in 2012 to $17.8 trillion in 2014 – an 11% increase in two years.
By comparison, the national debt is projected to rise from $20.2 trillion in 2017 to $22.7 trillion by the end of 2019 – a 12% rise in just two years.
For context, US national debt equaled 99% of US GDP in 2012. In other words, government debt was nearly equal to the monetary value of all goods and services produced within the country that year.
Today, US debt-to-GDP is roughly 111% based on 2018 GDP forecasts...meaning government debt will exceed the value of all goods and services produced in the country this year.
Looking forward, government debt is projected to hit $27 trillion by 2023...a 38% increase since President Trump took office in January 2017.
But these projections assume "business as usual" in Washington. In other words, these estimates presume that the rate of government borrowing remains constant.
But as Bill has said many times, the federal government will not allow the necessary corrections to occur when the next crisis hits. Instead, it will likely respond with a massive spending program...which will send debt soaring past current projections and put America's financial future in peril.


 Email us
