Gold Stocks Break Out vs. SPX
Buggish gold investors, fear not...
The GOLD STOCK sector is on the verge of taking back the macro, and taking leadership over the broad S&P500, says Gary Tanashian in his Notes from the Rabbit Hole.
This post is prompted by a post I saw on X, highlighting a technical analyst on CNBC who noted the inverted head and shoulders that the HUI index of gold mining stocks is establishing in ratio to SPX.
The follow-on discussion included some fretting that the contrarian negatives of being highlighted on CNBC are a clear and present danger.
As you know if you've read me or heard me talking about gold stocks this year, I believe the macro is and has been in transition to a state that will take many by surprise, including gold bugs. As for the contrary negative of a CNBC highlight, it's been 4 years in hell since gold stocks topped out in summer 2020 (rightly, given the macro backdrop since then, I might add).
It has also been 4 years during which gold stocks have been drubbed by the headline US stock index. It is beyond the scope of this post to dredge up all the macro reasoning about why it is different this time. Again, if you read and heard me, you already know.
This article simply illustrates the beauty of the ratio between the HUI and the S&P and its message that there is no way there could be much damaging contrary sentiment out there presently.
Here is a weekly chart showing the ratio. Ladies and Gentlemen, cast your gaze upon some real eye candy. It has been 4 damn years in the wilderness for this most hated of stock sectors. A non-constructive macro has bred that hatred.
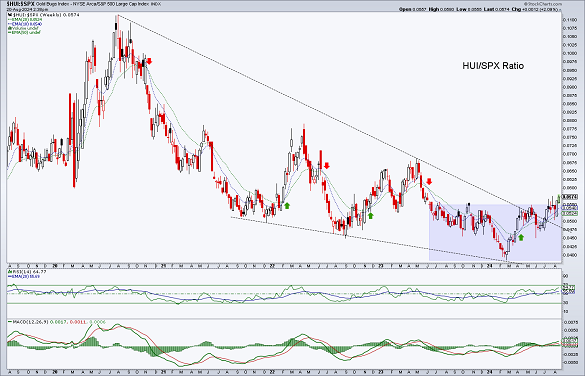
But a constructive macro coming from the depths of this chart's base/bottom? It's only just getting started.
Of course there will be volatility and testing of will. But when you have the fundamentals behind you, it sure is easier to deal with that. The ratio is creeping out of the pattern, has positive and yet not overbought weekly RSI and MACD, and is good to go. Finally, the weekly EMA 10 is crossed above the EMA 20 and that is a positive as well. A "buy" signal of sorts from April.
Now we'll see if it goes. If not now, and if the macro continues to pivot as it has been, it'll go soon enough, in my opinion.
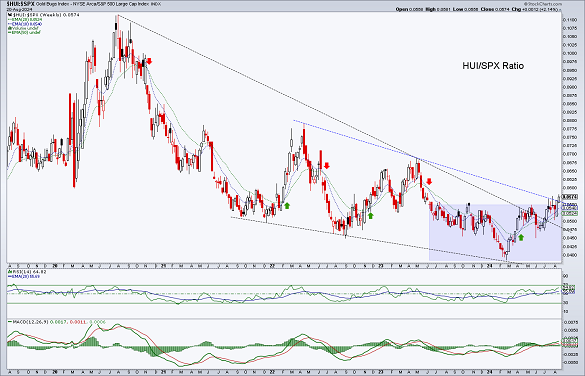
This chart shows an alternate interpretation of the breakout (blue line). In this version it is just an in-week break, needing a weekly close to send a signal.
Mr.Slammy? You out there? I don't put much importance on trend lines as you may know, but I wanted to put this version out there. Of more importance is the creep above the pattern's neckline.


 Email us