Gold News

Gold's Correlation with US Federal Debt
Price correlated more strongly than with silver...!

WHO would have guessed it? asks Adrian Ash at BullionVault.
 
Trying to look at gold's correlation with US government debt, and how its price is also correlated against the performance of investment asset classes like silver or inflation-protected Treasury bonds, we got distracted...
 
...and stumbled over this fact:
 
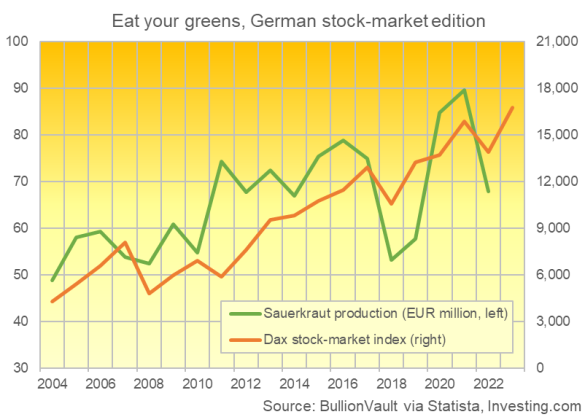
Germany makes more sauerkraut when the stock market goes up.
 
Yes, really. Or maybe it's the other way around.
 
Maybe eating pickled cabbage makes investors hungry for German shares.
 
Chart of Germany's Dax index vs. value of sauerkraut production. Source: BullionVault
 
Quite what this means for gold prices or their correlation with US government debt, we can't say.
 
And no – we don't, as yet, have the latest data for how much sauerkraut was pickled and bottled or canned by factories in Germany in 2023.
 
But if the relationship with the Dax index held strong, then it was probably a lot!
 
Still, correlation isn't causation of course, as spoil-sport scientists like to say.
 
(Nor, by the way, can you trade top sauerkraut brand Hengstenberg on the Frankfurt stock market either. It's a privately-owned, family-run business.)
 
But don't let such boring facts ruin your fun. Nor your next hot investment tip.
 
I mean, who knew that US households love to go shopping when the price of cookies goes up?
 
Yes, it's true. Based on monthly data, US retail spending shows a 0.91 correlation across the last 10 years with the average price of chocolate chip cookies.
 
Quite how this connection works, I can't guess. A sugar rush maybe? But that figure – simply taking the 'r' coefficient across all months since 2014 – would read 1.00 if cookie prices and total retail spending moved precisely in lockstep. They'd move exactly opposite if it read minus 1.00 instead.
 
So the reading of +0.91 must mean something, right? Over the past 10 years, it's been stronger than the correlation of US retail sales with the price of ground beef (0.82) or with sliced bacon (0.83) or with potatoes (0.84) or even – get this – with the price of gold bullion (0.87).
 
Trust me. I did the maths. No-one else was going to.
 
In fact, the cookie-retail correlation is so strong, it almost matches the well-known and much-reported relationship between the price of gold and the total amount of debt owed by the US federal government and – therefore – owed by US taxpayers.
 
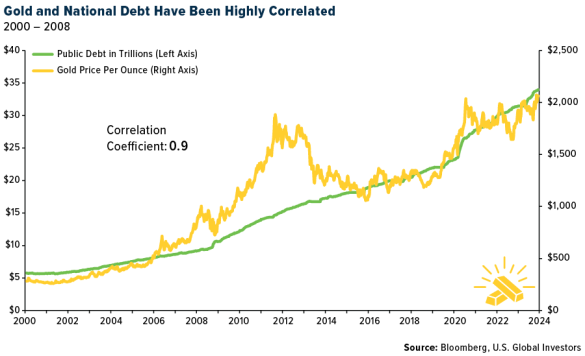
Chart of US federal debt vs. Dollar gold price. Source: US Global Investors
 
No doubt you've seen this chart before. Or something like it.
 
Lots of analysts, pundits and salesmen like to compare the development of gold prices with the growth in America's total national debt.
 
And why not? Since the year 2000 they have both gone up. A lot.
 
"US national debt just crossed above $34 trillion for the first time, the equivalent of $101,000 per citizen or $264,000 per taxpayer," says fund manager Frank Holmes at US Global Investors, posting the chart above.
 
"Since the start of this century, national debt and gold have shared a strong positive correlation coefficient of 0.9. In simple terms, this means that both have tended to make similar moves day-to-day.
 
"[So] if you think debt is headed higher, it may make sense to consider an investment in physical gold and gold mining stocks."
 
Simple, right? A bit too simple perhaps? 
 
Over a period of months or years, any 2 things which have both risen in value are pretty much certain to show a positive correlation when you run the numbers through "=CORREL" on an Excel spreadsheet.
 
But that doesn't mean that they moved together in the meantime. On the contrary, they might have moved opposite more often than not.
 

Table of gold price correlations

This table tracks the gold price in Dollars, month-end data, against a range of other investment assets and economic factors.


The first column shows you the 'simple' correlation. It calculates the 'r' coefficient between the price of gold in Dollars with US government debt – as well as with the different investment assets and other economic factors listed – across the last 120 months.
 
The second column, in contrast, looks at the correlation across each and every 12-month period. It then shows you the typical 12-month reading of the 'r' coefficient given across the last 10 years.
 
See how it changes?
 
Then in Column 3, you get the r-squared of that average correlation – a really boring spoilsport number which double checks the 'r' to see how closely 2 things are really correlated. See how, for most of the relationships in our table, it completely undermines the shock-horror value of our first reading in Column 1?
 
Take the Nasdaq index of US corporate shares, for instance.
 
Across the past 10 years as a whole, the Nasdaq shows a very strong r-coefficient with gold of +0.91. But that only really shows how stocks, like gold, have risen long-term. And within those 10 years, the Nasdaq typically showed next to no correlation with the price of gold.
 
The median 12-month reading was in fact slightly negative. Very slightly. And it sinks pretty much to zero on the r-squared.
 
"In finance, an R-squared above 70% would generally be seen as showing a high level of correlation," says Investopedia, "whereas a measure below 40% would show a low correlation. This is not a hard rule, however, and will depend on the specific analysis."
 
Put another way however, as one genuine statistics expert does, "Some fields of study have an inherently greater amount of unexplainable variation. In these areas, your R2 values are bound to be lower. For example, studies that try to explain human behavior generally have R2 values less than 50%.
 
"People are just harder to predict than things like physical processes" in short. And gold-market prices, like equities or Bitcoin or even the size of the US federal debt, are very human at root.
 
Now contrast the Nasdaq with silver. Even though, in the first column above, silver's headline price correlation with gold is good and strong at +0.85, that reading comes below US government debt, below the Nasdaq, and below the CPI cost-of-living index, too.
 
But drill into the data, and silver's ancient and continued relationship with the price of gold jumps out. Because on the median 12-month reading, silver shows the strongest correlation in our sample, and its r-squared with gold is streets ahead of anything else here.
 
Next strongest? Real yields, meaning the rate of interest over and above the pace of inflation, offered by 10-year inflation-protected Treasury bonds. That median 12-month 'r' with gold comes in at minus 0.64, a strongly negative reading that signals a much more powerful connection than gold prices show with Bitcoin, for instance. Yet across the past 10 years as a whole, the real yield shows a much weaker connection in Column One.
 
Real yields' solid r-squared with gold also masks the big shock of gold's price action so far this decade...
 
...a shock which analysts, traders and pundits continue to highlight...
 
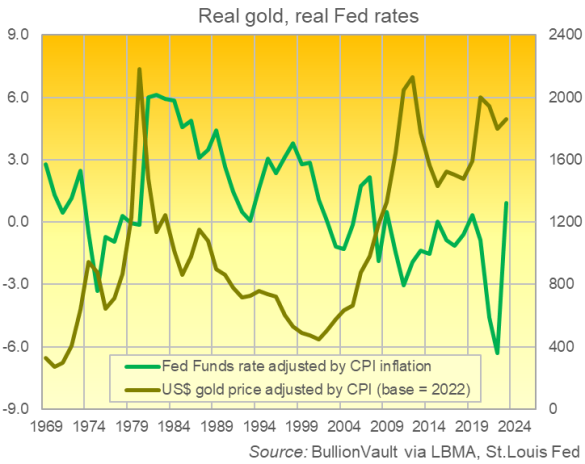
...gasping at how gold has shrugged off the steepest rise in real yields since pretty much forever, rising to new all-time highs against all major currencies and holding close to its all-time record highs in real terms, after you account for inflation, even as the real rate offered by TIPS bonds has jumped.
 
Chart of annual average US Fed interest rate, after inflation, versus the real price of gold (in 2022 dollars). Source: BullionVault
 
Correlations come and go over time. And even when they hold firm, looking at just one measure across one time frame doesn't show you the whole picture.
 
Nor does looking at the correlation of just one thing against one other thing, either.
 
US stocks, for instance, show a slightly stronger 10-year correlation with the US national debt than even gold does, up at 0.97 against gold's reading of 0.96 across the past 120 months.
 
More notably over the last 10 years, the Nasdaq's median 12-month correlation with the US national debt is very much stronger than gold's.
 
It reads 0.69 against gold's figure of 0.50, and that gives the Nasdaq an r-squared relationship with US national debt of 48%, beating even gold's rolling 12-month r-squared with the real interest rates on US TIPS bonds.
 
But who ever told you to buy US stocks because of runaway US government borrowing?
 
Still, the continuing correlation of gold prices to the US national debt bears study. So as Frank Holmes at US Global Investors says, "I believe [US government debt] is a good place to look if you want to know where gold may be headed in the coming months and years."
 
BullionVault users are starting to agree. Our latest survey of what customers are thinking found that, when asked to name the biggest driver of precious metals' prices for 2024, bullion investors put 'Monetary policy' at No.1 with 25.0% of all votes.
 
Close behind came 'Geopolitics' at 22.0% and then, just behind in 3rd place, sits 'Government spending (and the size of government deficits)' at 20.8%...
 
...its highest-ever reading in our twice-annual survey starting a decade ago.
 
Sum it all up, and 'Politics' wins hands down as the big driver of precious metals prices in 2024 according to BullionVault users, whether at central banks, at the finance ministry, or at the department of defence (and attack).
 
So far the market seems to agree, because a Happy New Year this isn't.
 
Maybe a sugar-filled snack would help? Or failing that, some sauerkraut?
 

Adrian Ash

Adrian Ash, BullionVault Gold News

Adrian Ash is director of research at BullionVault, the world-leading physical gold, silver, platinum and palladium market for private investors online. Formerly head of editorial at London's top publisher of private-investment advice, he was City correspondent for The Daily Reckoning from 2003 to 2008, and he has now been researching and writing daily analysis of precious metals and the wider financial markets for over 20 years. A frequent guest on BBC radio and television, Adrian is regularly quoted by the Financial Times, MarketWatch and many other respected news outlets, and his views from inside the bullion market have been sought by the Economist magazine, CNBC, Bloomberg, Germany's Handelsblatt and FAZ, plus Italy's Il Sole 24 Ore.

See the full archive of Adrian Ash articles on GoldNews.

Please Note: All articles published here are to inform your thinking, not lead it. Only you can decide the best place for your money, and any decision you make will put your money at risk. Information or data included here may have already been overtaken by events – and must be verified elsewhere – should you choose to act on it. Please review our Terms & Conditions for accessing Gold News.

Follow Us

Facebook Youtube Twitter LinkedIn


Market Fundamentals