Who's Buying Gold? Who Counts?
Gold buying for jewelry vs. investing, bars, coin...
GOLD is many things to many people, writes Adrian Ash at BullionVault in this report sent Monday to customers receiving the Weekly Update email.
Buy it as a simple band, and it's a token of love in marriage.
Buy gold drawn into thin strands, and it's bonding wire for the chips in your PC and phone.
Minted into coins, it's a collectible for some...
...or a way for others of holding 'emergency' purchasing power close-to-hand.
And cast into large bars of bullion, buying gold is a safe-haven investment for many and a cost-efficient way of sourcing the raw material for jewellers, tech companies, mints and pretty much every other gold-using factory you can think of.
Who gets to decide the price?
No one in particular. Gold is a huge global market...
...trading almost as much by value as New York's S&P500 share index each day...
...with wholesale trade in those large 400-ounce bars through London and Zurich averaging $283 billion per week at last count.
So your Diwali donation to your local temple, or your Lunar New Year gift of gold to your grandchildren, isn't likely to have much impact.
Nor will your personal purchase or sale of, say, £5,000 or €50,000 or even $500,000 in vaulted bullion.
But added together with the millions of other buying and selling decisions each day?
It depends what you're buying. And why.
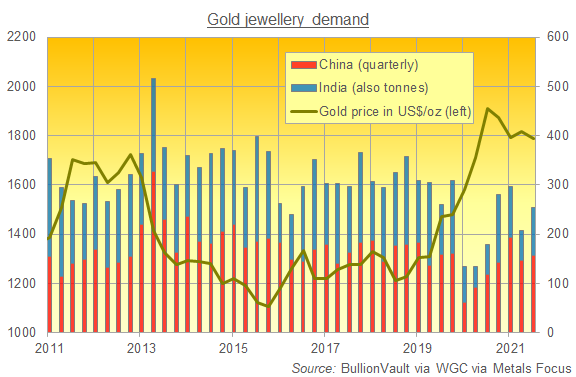
Jewelry accounts for one-half of global gold demand.
Over the last 10 years, it ate 50.3% of visible purchases to be precise. That's according to the invaluable quarterly data gathered and analyzed and published by the mining industry's World Gold Council.
Buying gold as jewelry accounted for 6 times as much of the metal as went into technology and dental fillings combined...
...10 times the quantity that went into gold coins like the American Eagle or British Sovereign...
...and 14 times the weight of metal added to gold-backed ETF investment trust funds between 2011 and 2020.
Yet despite its out-sized role in the global gold market, jewelry demand does not drive prices higher or lower.
Quite the reverse, in fact.
Demand for gold bracelets, necklaces and rings tends to retreat when prices jump. It grows by weight when gold becomes cheaper.
You can see this in our chart above.
China and India dominate gold jewelry worldwide. Between 2011 and 2020, households in the 2 most populous nations bought more than one-third of all the new gold unearthed by gold miners worldwide.
This massive demand spikes with the 2 key festivals of Diwali (happy Diwali for last week, by the way) and then Chinese New Year.
Tuesday 1 February 2022 will kick off the Year of the Tiger. It's sure to mark the single heaviest gold-buying event on the bullion market's calendar.
But it's very unlikely to have a material impact on the gold price, nor on its underlying direction.
Checking the quarterly data from the World Gold Council, we find that the weight of Chinese and Indian jewelry demand rose or fell together with the global gold price less than 40% of the time since the start of 2011.
In the jargon of financial analysts, it shows a negative correlation with Dollar gold prices...
...minus 0.43 on the "r" coefficient, where a reading of +1.00 would mark 2 things moving perfectly in lock-step with each other.
The world's biggest jewelry consumers tend react to prices, in other words...
...buying more when prices fall and easing off when the gold price jumps. Which is sensible.
What about coins and small bars?
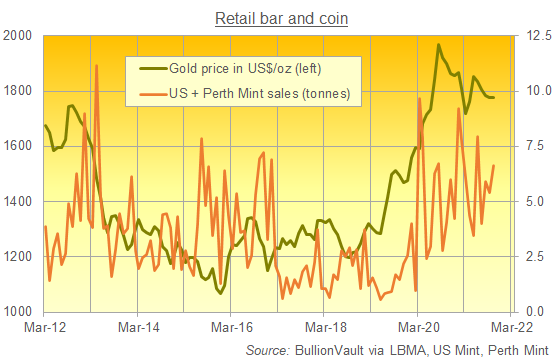
The US Mint and its competitor the Perth Mint in Australia may not be the biggest of coin or small-bar manufacturers.
But between them they do produce top-selling coins...led by the US Eagle and Buffalo...as well as increasingly popular small bars for the retail market from Perth.
More usefully for your Weekly Update today, they also both produce monthly sales data. So we can track how those sales grow or fall when prices rise or decline.
And as today's 2nd chart shows, retail bar and coin demand tends like jewelry to move inversely to prices.
Yes, there are exceptions to this rule.
Gold's bear-market low of Christmas 2015, for instance, found coin-and-small-bar buyers just as moody on the metal as the price would suggest.
They then reverted to type...staying shy of buying gold as prices then rose across 2019 and into 2020...but piled in as the Covid Crisis of March last year spurred gold up towards its current all-time highs of $2000 per ounce.
Overall however, the basic pattern is plain.
Retail bar-and-coin sales show a negative correlation with gold prices.
An "r" coefficient of minus 0.19 if you must know. And the single heaviest month for bullion coin and small-bar sales of recent years was April 2013, when the looming end to the US Federal Reserve's financial-crisis stimulus spurred a historic crash in gold prices.
What about central bank buying? Does that show a strongly positive connection to prices?
Nope, not on the data. Central banks are in fact more contrarian than coin buyers or jewelry consumers...
...showing a negative correlation with gold prices of minus 0.54 on average across the last decade.
That leaves private investment. More specifically, the big-money decisions putting cash into (or pulling it out of) large bars and also into the derivatives market, where traders bet on prices going higher or lower.
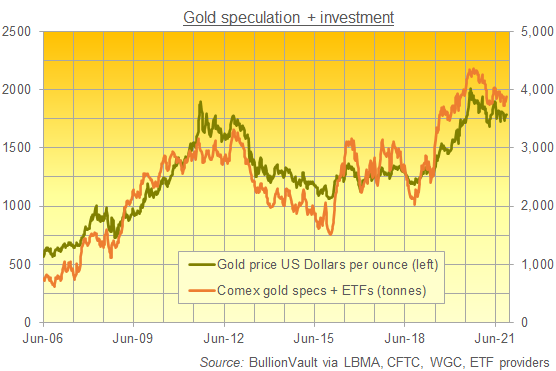
It makes sense that, alone among the myriad sources of gold demand worldwide, money managers should buy more when prices rise and sell it when gold falls.
Chasing the trend is, after all, what professional investors are paid to do.
And in gold, they do it repeatedly, as our fourth chart shows.
Our graph isn't perfect of course. It can't include the unknowable data for private wealth holdings of London or Zurich bullion...
...directly owned in the way that you can own gold outright as your personal property using BullionVault...
...because those figures don't exist in the way that Comex gold futures and options bets or stock-market traded ETF holdings are tracked.
But those 2 items, added together, show us a big if not dominant chunk of total private investment and speculation in gold. And the correlation is frankly startling.
Using weekly data for the last 15 years, and tracking the 3-month relationship, we find that money managers' net position in gold derivatives...plus the sum total of gold held to back ETF products...have an average correlation of +0.89 with US Dollar gold prices.
Correlation isn't causation, as statisticians love to say.
But to double-check what looks like a very strong reading, they sometimes like to multiply the "r" coefficient by itself...
...creating the "r-squared" and showing it as a percentage.
100% would mean that speculative and investment interest in gold moved absolutely in lockstep with prices.
Across the last 15 years, that figure in fact reads above 79.7%.
So what, you might ask.
It's not rocket surgery to guess that investment flows drive prices higher or lower.
Most especially flows from big investors in the wider financial markets...rather than from private collectors or households with a taste for buying gold coins or jewellery whatever the weather.
But here in late-2021, the surge of inflation in the cost of living has spooked central banks into talking about tightening their monetary policy.
Leading the pack, the US Federal Reserve has finally started reducing the quantity of new QE money it creates and spends on buying government bonds each month.
Last time this "tapering" followed the end of a dramatic economic crisis, gold prices sank.
Spring 2013 saw the metal sink by 25% inside 3 months. Some of us still wake up in a cold sweat sometimes, shivering at the shock 8 years later.
Prior to last Wednesday's Fed announcement however, "Investors had 4 months to exit gold ahead of the taper," as analysis for Swiss refining group MKS Pamp observed.
"They have not."
Long story short, 2020 was always going to be a tough act to follow for gold investment flows and therefore prices.
Last year saw investment inflows eat a record proportion of total gold demand. (NB: Silver and platinum saw the same thing.)
But while repeating or exceeding those inflows was more unlikely in 2021 than a climate-change conference actually making a difference, last year's buyers haven't rushed for the exits.
On the contrary, the vast majority have held on, even as central banks...having finally succeeded in bringing inflation back to life...have either started raising interest rates or begun talking and talking and talking about it.
"With the short-term overhang and threat of the Fed taper [now] behind it, gold becomes 'free again' to price in more of [today's] longer-term drivers," says MKS...
...meaning the "inflation/stagflation threat, bigger US government, peak [mine] supply growth, higher cost of [mining] production floors, Fed policy mistakes, [and an] unsustainable [government] debt trajectory ensuring lower real [interest] rates for the foreseeable future."
Whatever the future might bring, gold prices remain pretty high by historical standards.
On average across the last 12 months, in fact, gold has cost $1808 per ounce...
...only a touch below the record $1849 reached on the 12-month average this June.
That could pose a risk of a steep decline, perhaps.
But one last thing to note today.
Jewellery consumers and coin buyers are finally able to go shopping again after the Covid Coma of lockdown and restrictions.
So far, they are proving remarkably happy to swallow the premium prices being set by the solid positioning of investment managers and traders.
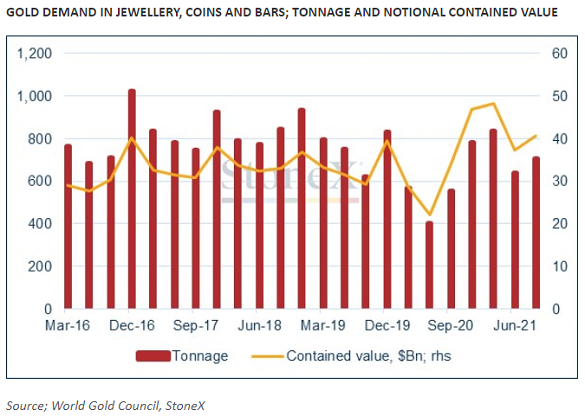
This chart comes from leading gold-market analyst Rhona O'Connell, now at financial and commodity brokers StoneX.
It shows gold jewellery, coin and small-bar demand worldwide by weight and, importantly, by value.
Says Rhona:
"Delving into the numbers [released by the World Gold Council last month] shows that pent-up demand is, as we should expect, being released in areas where the virus has been easing."
On a tonnage basis, the recovery is solid if not spectacular. Because after slumping to 891 tonnes across the first 9 months of 2020, jewelry demand so far in 2021 has risen to 1,323 tonnes...
...barely 15% below the pre-Covid average of 2016 to 2019.
"But [while] we still have some way to go" in jewellery demand by weight, Rhona explains, "the notional expenditure, purely in terms of the contained gold value in jewelry and coins-plus-bars, has soared in the first nine months of this year.
"At $126 billion, this is 35% higher than the average for the first nine months of 2016-2019."
Nothing is certain of course. (That's why we invest in precious metals in the first place, as a hedge against what the future might bring for the economy and financial markets.)
But while the US Fed has begun reining back its pandemic stimulus, gold investment remains solid...
...and consumer demand has accepted today's markedly higher prices.
2013 this ain't. Thank heaven.
But if it were, and if investment managers suddenly run for the door, the floor beneath prices from consumer demand looks very solid indeed.




 Email us