Example of the 'BullionVault Weekly Update'
BullionVault Weekly Update
Maga-nomics vs. the dot plot...
Tuesday, 18 March 2025
| In the markets today... |
|
|
|
|
For up-to-the-minute live spot gold and silver prices use the BullionVault chart
Just a Little Transition from Adrian Ash Director of Research, BullionVault
WHEN the central bank hurts the economy, it's good.
Painful, but good. Or so central bankers keep saying.
But if the elected government does it? Then it's bad, pure and simple.
Or so the anti-Trump media keep saying.
"The proposition that Trump's policies might hurt the economy isn't liberal propaganda," bleats MSNBC. "Last year, Elon Musk literally predicted his and Trump's economic policies would crash the economy." Such whining isn't new. The 'liberal media' began hyperventilating about Trump 2.0 causing a recession as far back as 2023. And now that Trump is back in power, the White House agrees with them!
"Howard Lutnick, the commerce secretary, has said Mr.Trump's policies are 'worth it' even if they cause a recession," gasps the New York Times today. "Scott Bessent, the Treasury secretary, has said the economy may need a 'detox period' after becoming dependent on government spending.
"And Mr.Trump has said there will be a 'period of transition' as his policies take effect."
A little pain, so much gain. Right, America? |
|
 |
|
|
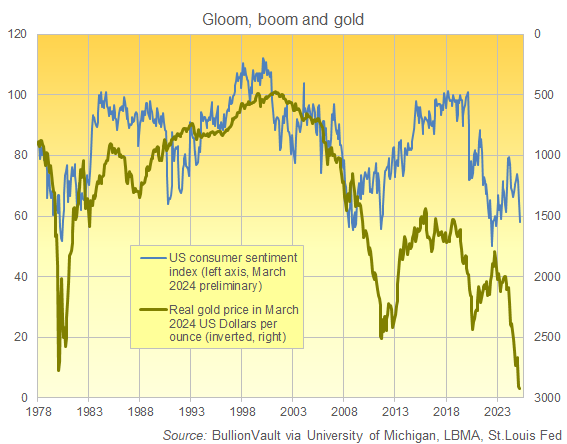
US consumers are suddenly gloomy.
Very gloomy. Very suddenly. That, at least, is what the University of Michigan's first survey report for March 2025 said on Friday.
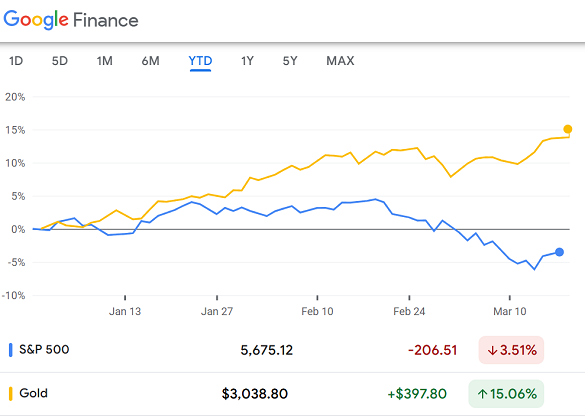
Just ahead of that news, gold broke $3000 for the first time in history. (But maybe not the last.) Longer-term, and on a 5-year horizon, the level of US consumer confidence has gone in the opposite direction to the price of gold...adjusted for US inflation...almost 80% of the time since 1978. (Our chart above inverts the real price of gold, the better to show the connection.)
So more gloom *should* be great for gold. And hurrah! Here come Trump, Bessent, Lutnick and Musk to destroy jobs and growth.
"Amid signs of investor unease, the Trump administration insists it aims to help Main Street, not Wall Street," says the Washington Post...
|
|
 |
|
|
"...but the erratic pace and tone of Trump 2.0 is taking a toll on the stable economy the President inherited...
"...denting growth prospects and leaving Americans more downbeat than they have been in years."
Boo to Trump, in other words. Re-shoring factory jobs and cutting the federal debt might sound great long term. But don't try any shortcuts. You might hurt the economy.
And that tactic belongs to the central bank!
"There will be times when the Fed takes unpopular actions that cause short-term economic pain," explains a political scientist like he's wearing a lab coat. "However, given the institution's influence over long-term economic stability, shielding it from political pressures is crucial to preventing the implementation of short-sighted policies that could lead to prolonged financial harm."
Got that? Central banks must cause recessions sometimes. It's vital that politicians don't try to stop them.
Or so central banks keep saying. Y'know, kinda like US courts are now whining that they are independent of the Government and shouldn't get over-ruled by the White House. "Fed's Powell signals US recession may be price to pay" for cutting inflation, said Bloomberg in September 2022.
"No exit ramp for Fed's Powell until he creates a recession," agreed CNBC in March 2023, quoting yet another economist repeating the central bank consensus. Never mind they were wrong. The highest US interest rates in more than 2 decades coincided with inflation dropping sharply (although not as low as the Fed's 2.0% target) while failing to provoke a recession. But that's not how it's supposed to go. The way that monetary policy works to cap or curb inflation is by hurting the economy. Or so everyone agrees. It puts people out of work, thereby cooling consumer and industrial demand...
...taking the heat out of inflation. Which is all for the good, in the long run. Never mind if it costs you work or your business.
Whereas with Trump...? |
|
|
Tomorrow, the Federal Reserve...led by 'high-rates' Powell...will unveil its latest forecasts for inflation, unemployment, the economy, and interest rates.
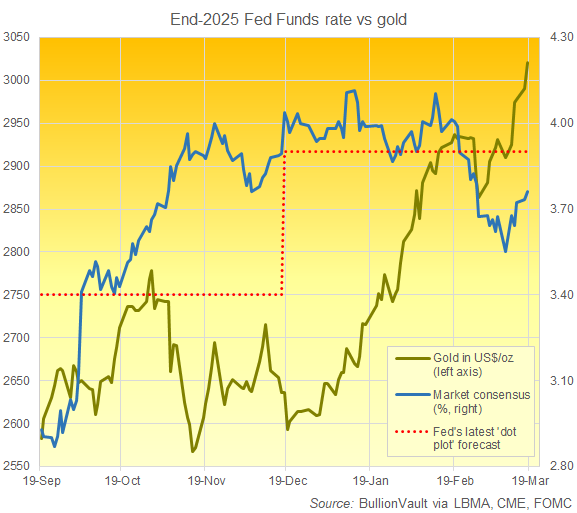
Last time out, back in December, the Federal Reserve said it expected US interest rates to end 2025 at 3.9%.
It should know, you might think. Because it sets that rate!
But the Fed's forecast was fully half-a-point higher than the forecast it had made only in September...
...and that re-rating, weirdly, matched exactly what the futures market was predicting for end-2025 interest rates at the time.
Fast forward to today, and the futures market now thinks the Fed should end the year a little lower than that, down at 3.76% on its consensus bets. And so it's likely that, despite all the chatter about Trump's trade tariffs raising the cost of living, the Fed will leave or adjust its own forecast lower again when it releases its new 'dot plot' predictions this Wednesday...
...because it has given in to the futures market's forecasts at each of the past 5 dot-plot updates.
Last June, for instance, the Fed raised its end-2024 prediction, only to cut it in September. Then the Fed raised its end-2025 forecast in its December dot plots. Either way, President Trump will no doubt think Fed rates are forecast too high for end 2025, and that they're way too high right now after tomorrow's "no change" decision.
"He was supposed to be a low-interest-rate guy," said Trump about Powell back in 2018, mid-way through the real-estate celebrity's first term in the White House. "It's turned out that he's not...I'm very unhappy."
15 months later, the same moan, even as the Fed began cutting interest rates.
"People are VERY disappointed in Jay Powell and the Federal Reserve," Trump said. "The Fed has called it wrong from the beginning."
To be clear: Gold hasn't cared much about Fed policy over the past couple of years.
High rates failed to crush it. Falling rates failed to send it soaring anywhere close to the boost it got from China's gold mania last spring or the approach of Trump's re-election last autumn. What's more, gold's run of fresh record highs has come as US investor demand for gold has gone AWOL, failing to rebound like Western European flows have started to do.
But now that Trump has returned, he's fighting against unelected bureaucrats while smacking the political-and-economic consensus square in the face.
And whatever your vote, a government that openly argues with its central bank pretty much demands that you buy gold to protect yourself. |
|
| Adrian Ash Director of Research, BullionVault
Key data and market events since our last Update and for the week ahead: |
|
|
PLEASE NOTE: This content is published to inform your thinking, not lead it. It does not constitute investment advice and the information above may have already been overtaken by other events. You should not rely on any forward projections stated or implied and previous price trends are no guarantee of future movements. Any decision you make to invest may put your money at risk. If you are unable to assess this information or are unsure if precious metals are suitable for your personal circumstances, you should seek professional investment advice. Precious metals are a physical commodity not an investment within the terms and scope of the Financial Services and Markets Act 2000.


